Ratio of C/O from He burning#
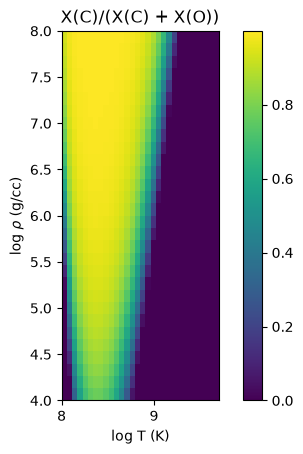
When burning He, the relative amount of C vs. O produced from \({}^4\mathrm{He}(\alpha\alpha,\gamma){}^{12}\mathrm{C}(\alpha,\gamma){}^{16}\mathrm{O}\) is strongly dependent on the thermodynamic conditions. If the 3-\(\alpha\) rate is fast, then all of the He can be locked up in C before much O gets a chance to form. Here we look at the ratio of C and O as a function of density and temperature. We hold the density and temperature constant during the burn.
import pynucastro as pyna
First create a simple He burning network
rl = pyna.ReacLibLibrary()
lib = rl.linking_nuclei(["he4", "c12", "o16"], with_reverse=False)

net = pyna.PythonNetwork(libraries=[lib])
net.write_network("heburn.py")
import heburn
import numpy as np
from scipy.integrate import solve_ivp
Define the initial composition (molar fraction) as pure He
from pynucastro.screening import screen5
Here’s our function that will take \((\rho, T)\) and integrate until the mass fraction of He drops to \(10^{-3}\) and then return \(X({}^{12}\mathrm{C})/(X({}^{12}\mathrm{C}) + X({}^{16}\mathrm{O}))\)
def doit(rho, T):
    # set a really long stop time -- most runs will end before this
    # because of the event trigger
    tmax = 1.e35

    comp = pyna.Composition(net.unique_nuclei, small=0.0)
    comp.X[pyna.Nucleus("he4")] = 1.0
    sol = net.integrate_network(tmax, rho, T, comp,
                                rtol=1.e-6, atol=1.e-8,
                                stopping_condition=("he4", 1.e-3))
    idx_c12 = net.unique_nuclei.index(pyna.Nucleus("c12"))
    idx_o16 = net.unique_nuclei.index(pyna.Nucleus("o16"))

    XC = sol.X[idx_c12, -1]
    XO = sol.X[idx_o16, -1]
    return XC / (XC + XO)
Setup a grid of temperature and density
nT = 30
nrho = 30

rhomin = 1.e4
rhomax = 1.e8

Tmin = 1.e8
Tmax = 5.e9
rhos = np.logspace(np.log10(rhomin), np.log10(rhomax), nrho)
Ts = np.logspace(np.log10(Tmin), np.log10(Tmax), nT)

ratio = np.zeros((nT, nrho))
Loop over the \((\rho, T)\) pairs and store the result in the ratio() array.
for i, T in enumerate(Ts):
    for j, rho in enumerate(rhos):
        ratio[i, j] = doit(rho, T)
import matplotlib.pyplot as plt
fig = plt.figure()
ax = fig.add_subplot(111)

im = ax.imshow(ratio.T, origin="lower",
               extent=[np.log10(Tmin), np.log10(Tmax),
                       np.log10(rhomin), np.log10(rhomax)])

fig.colorbar(im, ax=ax)

ax.set_xlabel("log T (K)")
ax.set_ylabel(r"log $\rho$ (g/cc)")
ax.set_title("X(C)/(X(C) + X(O))")
Text(0.5, 1.0, 'X(C)/(X(C) + X(O))')